Spatial Segregation of the Population of the City of Zurich: Extent, Development and Causes
1 June 2021 – Larissa Plüss
The city of Zurich has been experiencing strong population growth and dynamic structural development for some time now, which have permanently changed the composition of the resident population. A study on "resident segregation" on behalf of Zurich's urban development examined whether this also resulted in changes in social mixing and how the spatial distribution of the various population groups is fundamentally represented. The results show that the extent of segregation in the city of Zurich is low by international standards and that segregation has even decreased over time. The reasons for this are likely to lie mainly in the strong structural development in the city and the associated migration from outside.
Since the turn of the millennium, the city of Zurich has changed significantly – its population has grown by a good 20% and its building stock has been renewed more intensively than before. This dynamic has also been reflected in the composition of the population: the proportion of people with a tertiary education, of workers in highly qualified occupations and of families with school-age children has risen sharply in recent years. These changes are particularly pronounced in new residential replacement buildings. [1]
Has the city of Zurich achieved a better social mix in its neighbourhoods as a result? Or do these developments rather favor social segregation and segregation processes?
Study on the segregation of Zurich's resident population
In a study commissioned by Stadtentwicklung Zürich, these questions were investigated and the extent and change of resident segregation in the city of Zurich and the surrounding communities was examined on the basis of various socio-economic and demographic indicators. [2] In the study, household income is not taken into account, as no time comparison or comparison with the surrounding municipalities was possible due to the data available. However, since this is a central socio-economic indicator, household income was subsequently evaluated by urban development.
Segregation can be measured by comparing the distribution of certain population groups in a territorial unit with the corresponding population distribution in a smaller spatial unit. For example, the percentages of different age groups in the city as a whole are compared with the respective shares of these groups in all statistical districts of the city. Various segregation indices[3] are used to represent the resulting spatial inequality – the present study uses the segregation index and the Theil index. While the segregation index focuses on individual population groups and indicates how segregated they are from the rest of the population, the Theil index focuses on the corresponding spatial unit and measures the degree of segregation across all population groups.
Extent and development of segregation in the city of Zurich
The results of the study and the additional evaluations of urban development show that the extent of segregation in the city of Zurich is comparatively low with regard to the four indicators considered: 'age', 'nationality', 'unemployment' and 'household equivalised income' (see Fig. 1). For example, the segregation index used covers a scale from 0 to 100, with values below 30 considered low in the literature. The interpretation of the index is easy to understand: a value of 10 indicates that 10% of this population group would have to move so that their share of the population in all statistical quarters would correspond to their population share at the city level.
Figure 1 also clearly shows that the segregation of most population groups has decreased since 2010 – this is particularly evident in the indicators 'nationality' and 'unemployment'. In the case of the variable for income, no time comparison is possible due to a lack of data.
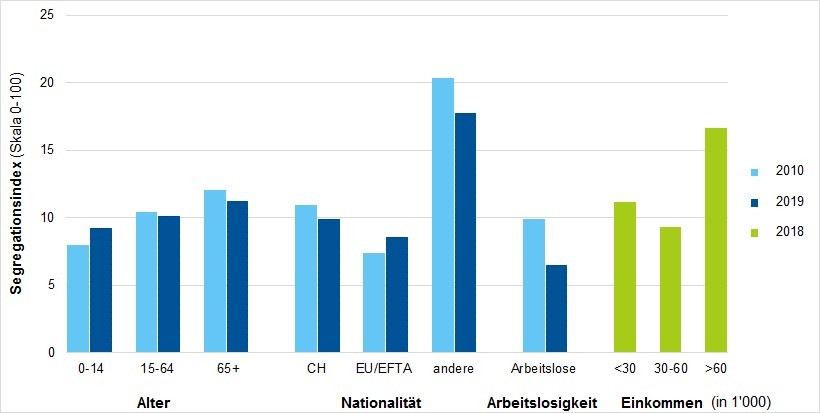
Slightly higher segregation values can be seen both in the group of foreigners from non-EU/EFTA countries and in the group of households with an equivalised income of over CHF 60,000. From the social space monitoring[5] of the urban development of Zurich, it is known in this regard that people from non-EU/EFTA countries are comparatively more often at home in the suburbs in the north and west, while the highest incomes are achieved on slopes on the Zürichberg, in the city center and around the lake. At least for the latter group of households with higher incomes, it is likely to be a so-called voluntary segregation.
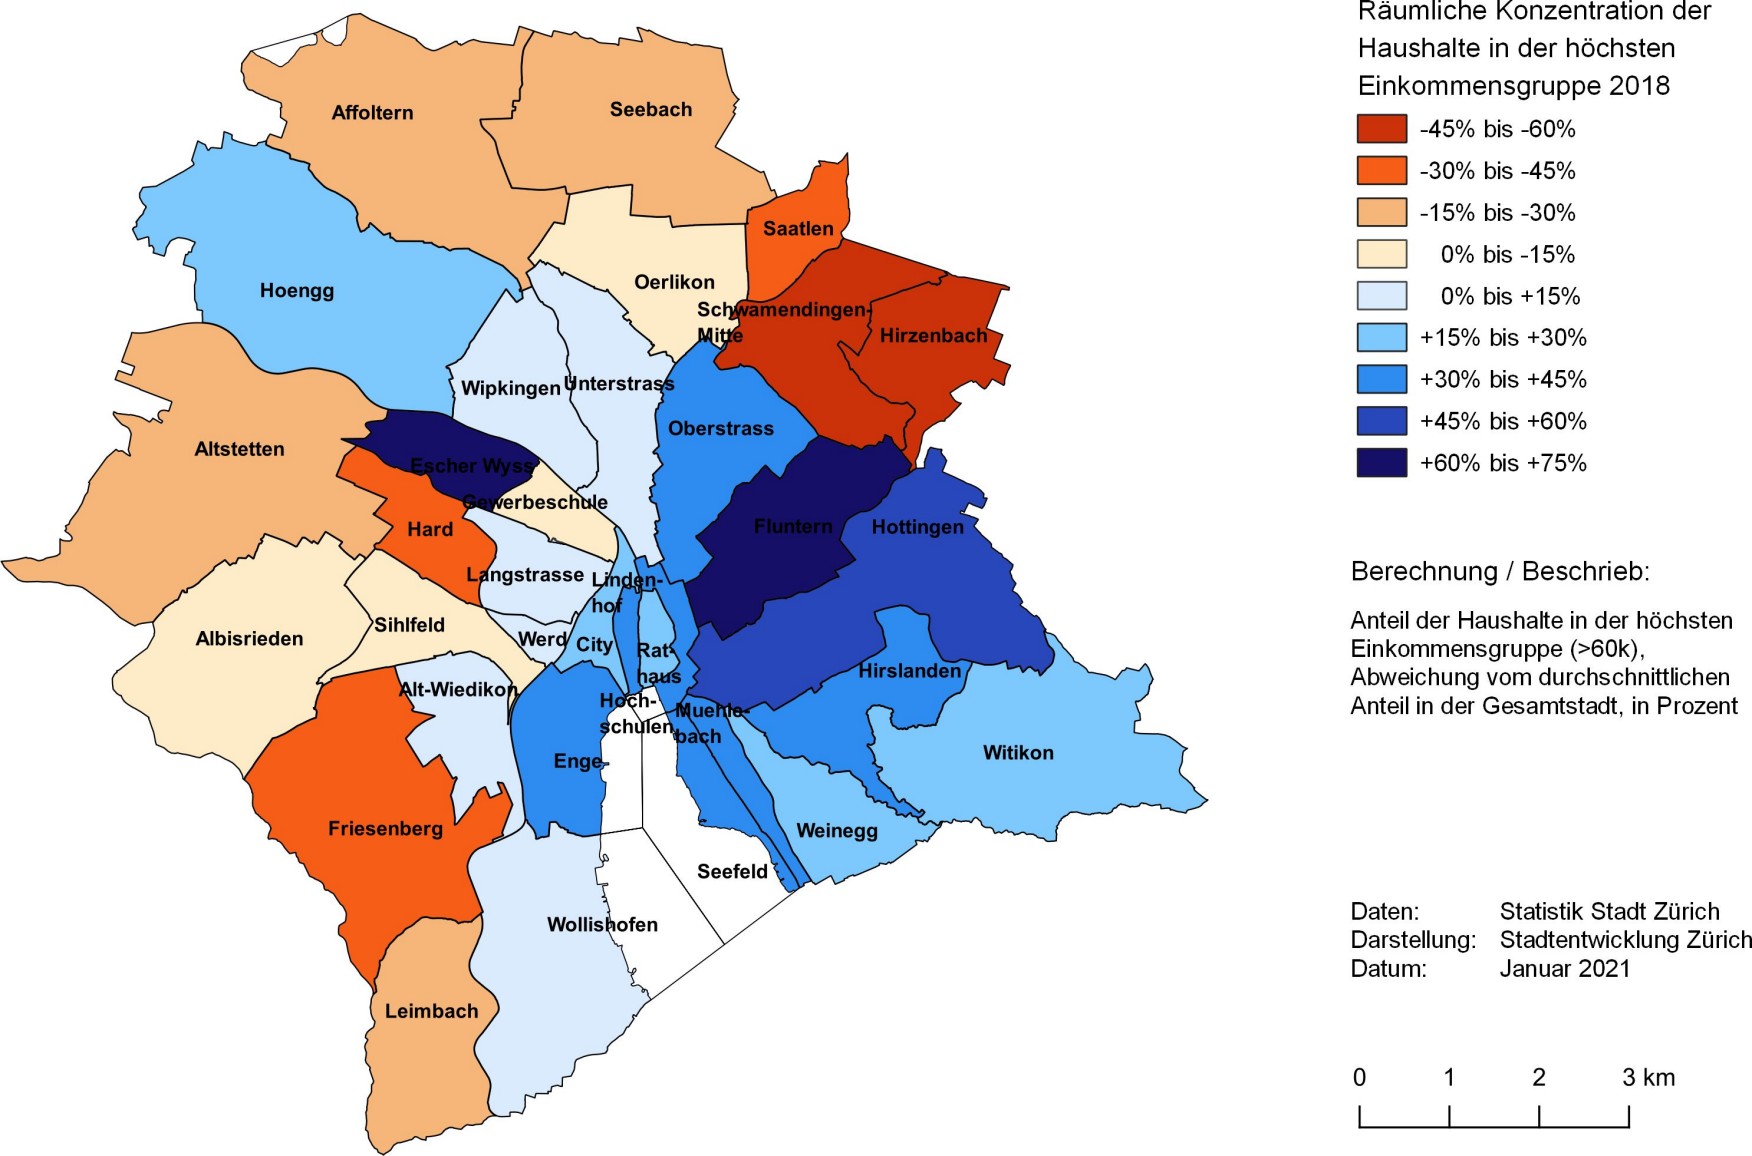
This uneven distribution of the highest income group can also be represented spatially by calculating the deviation of the population share of this group in the statistical quarters from its share in the city as a whole. As shown in Figure 2, the proportion of high-income households in the dark red neighbourhoods is up to 60% lower than in the city as a whole, while the dark blue quarters have at least as much increased proportion of this population group. For example, households with high incomes account for 17% of the total population in the Hirzenbach district – in the Escher Wyss and Fluntern districts, on the other hand, it is 58%.
View over the city limits
The city of Zurich is part of a larger functional space and the changing segregation patterns are not only caused by relocations within the urban area, but also by moving in and out. Therefore, when it comes to questions of population composition, it is always worth looking beyond the city limits.
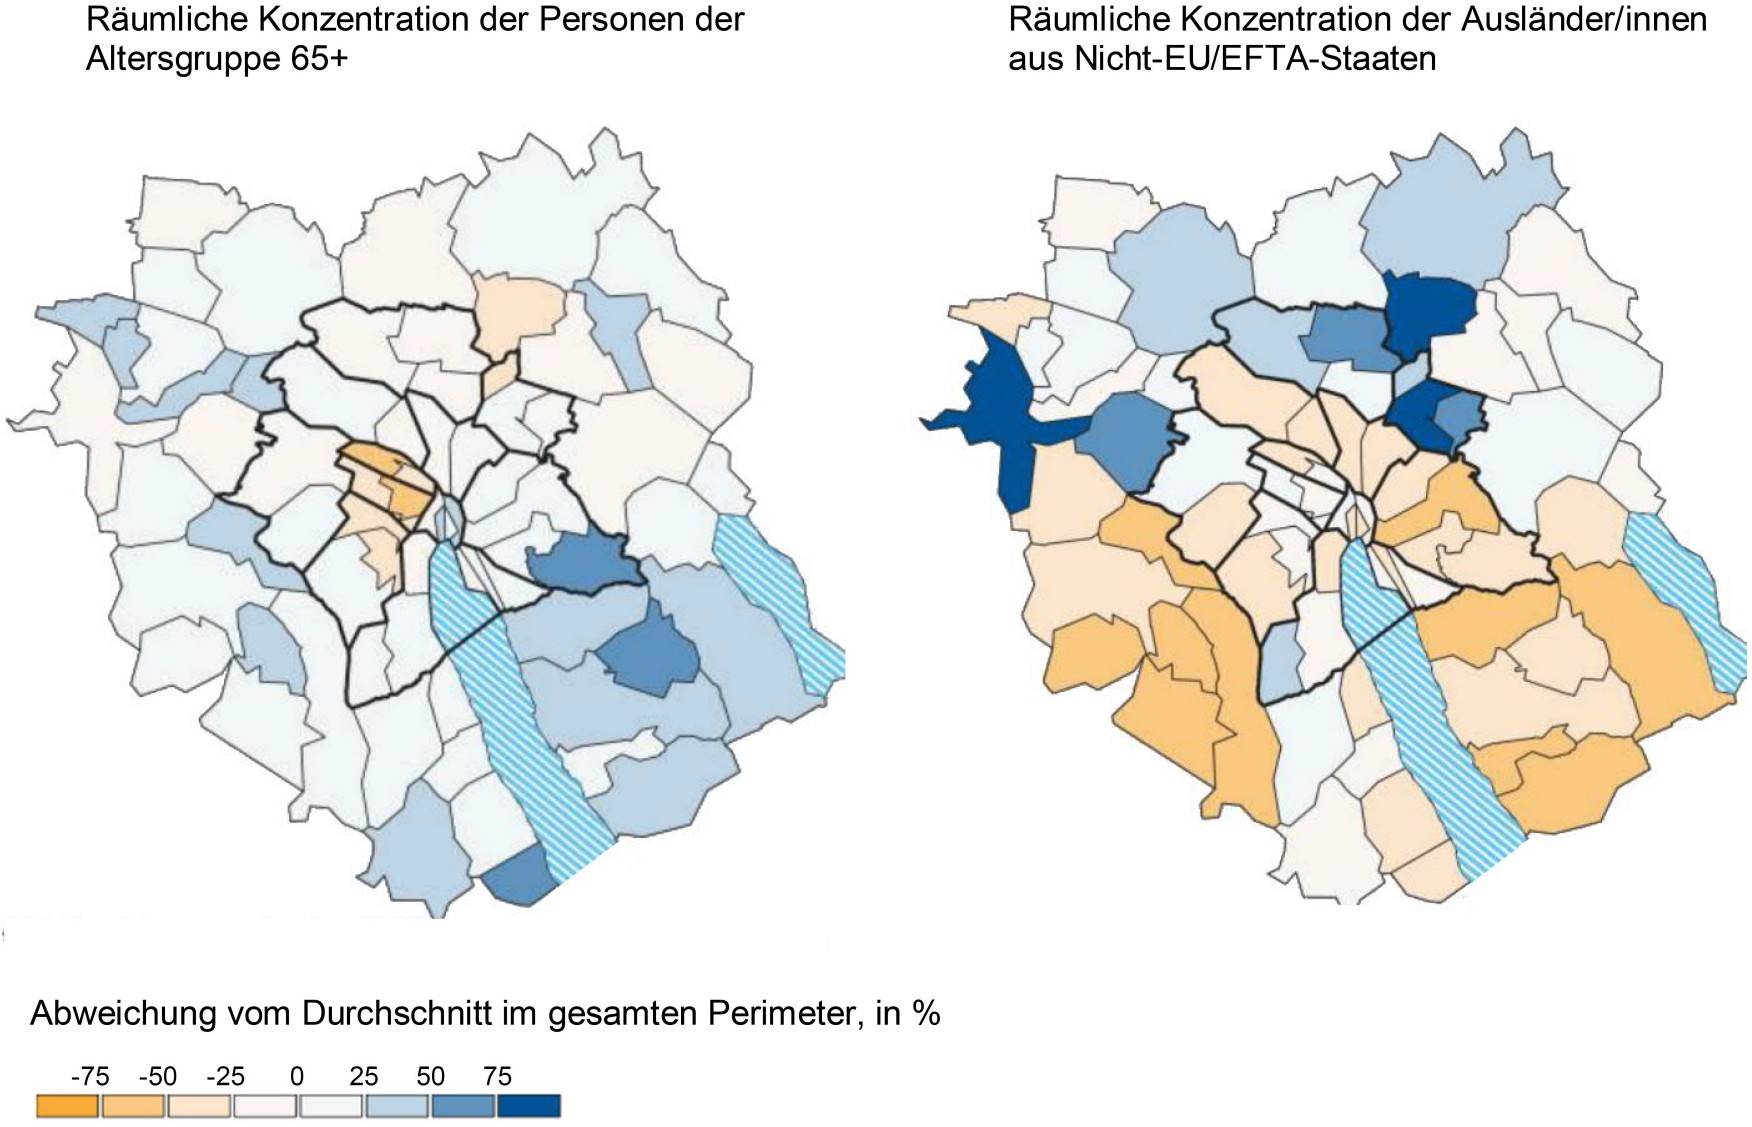
For a larger-scale analysis, the study included not only the city of Zurich but also the surrounding communities of the first two suburban belts of the Zurich agglomeration. The segregation indices were calculated by comparing the population distribution throughout the perimeter with the corresponding distribution at the level of the municipalities and the districts of Zurich (see Fig. 3). The spatial distribution patterns of two selected population groups are shown here: persons in the 65+ age group and foreigners from non-EU/EFTA countries. Due to the data available, no comparison with regard to income was possible.
Figure 3 clearly shows that the population distribution in the city of Zurich fits almost seamlessly into the larger perimeter with regard to the two indicators. It is also clear that the proportion of people in the age group 65+ on the right bank of Lake Zurich is above average. With regard to nationality, it can be seen that the group of foreigners from non-EU/EFTA countries is represented with above-average proportions, especially north of the city of Zurich, in the Limmat and Glatt valleys, and has a below-average presence south of the city limits. The study also notes that the overall extent of segregation in the surrounding communities is low and has fallen over the last ten years.
Segregation within the individual districts of Zurich
The distribution of the individual population groups in the districts of Zurich thus deviates to a comparatively small extent from the distribution in the city as a whole – in addition, the level of segregation has decreased for the most part in recent years. But what is the situation within the individual districts? The districts of Zurich have some population figures, which correspond to the population of small towns. It is therefore quite conceivable that important segregation processes could occur within these districts.
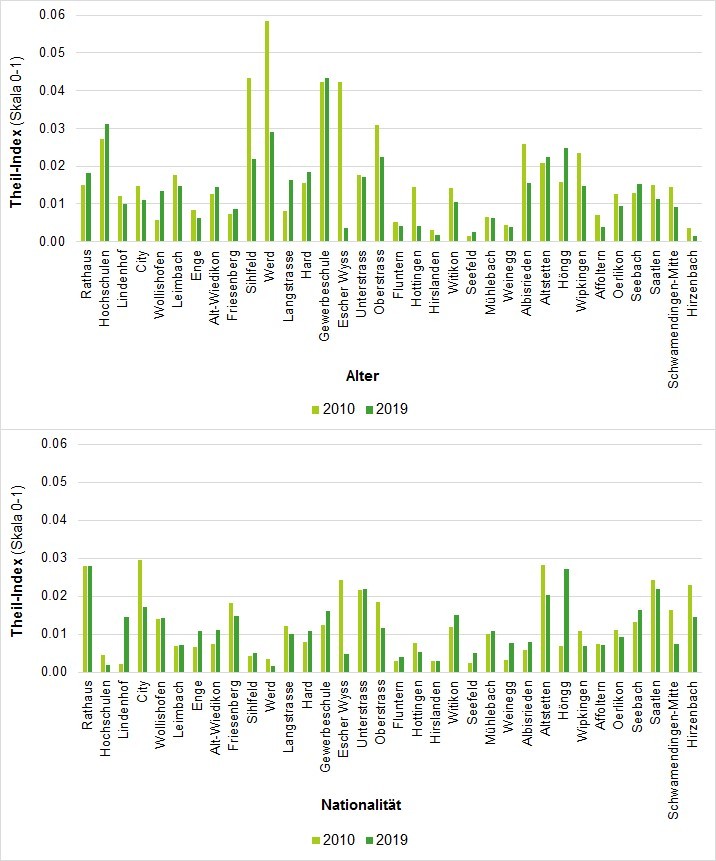
In order to track down such segregation developments, the distribution of population groups at district level is now compared with the corresponding distribution at the next deeper spatial level of the statistical zones. The calculation is carried out by means of the Theil Index, as this generates only one value per indicator and thus a certain clarity is guaranteed despite the high number of quarters. The Theil index measures segregation across all groups of an indicator and has a scale from 0 to 1.
Overall, the results confirm the pattern of decreasing segregation at a relatively low level. However, as Figure 4 shows, there are considerable differences between the districts. The indicators 'age', 'nationality' and 'household equivalised income' are shown here, with the first two indicators showing the most pronounced segregation. For the indicator 'unemployment', the maximum values are exceptionally low at 0.01 – the population composition in the statistical zones of the districts deviates only slightly from the distribution in the entire district. A presentation of this indicator has therefore been omitted.
In terms of age and nationality, Figure 4 shows that – in addition to the current, low figures – there has also been an alignment of segregation levels in the neighbourhoods. In 2019, for example, there are fewer districts in which the population is segregated above or below average than in 2010. The Escher Wyss district, for example, is striking, where segregation fell sharply during the period under review. This change is probably due to the dynamic structural development in the district – the population in this perimeter doubled from 2010 to 2019. In the Höngg district, on the other hand, the extent of segregation has increased significantly. Here, the changes can largely be attributed to the emergence of the Hönggerberg campus, which makes the affected statistical zone stand out strongly from the rest of the district in terms of average age and internationality.
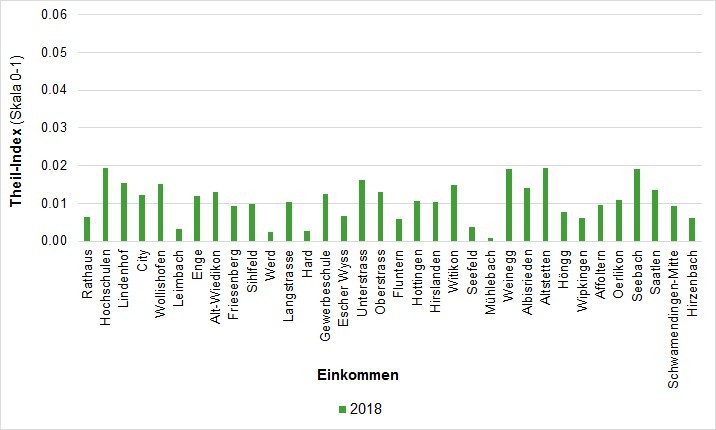
Due to the data available, no time comparison is possible for household income – but the values of 2018 show that segregation is very low in all districts. With values of no more than 0.02 (on a scale from 0 to 1), the statistical zones differ only slightly from the respective districts. The segregation within the districts of Zurich is thus much deeper than at the level of the city as a whole.
Structural development and population growth as central causes
The city of Zurich and its districts have become more mixed over the last few years – the level of segregation is low by international standards and there are no strong spatial clusters. This is basically good news – but the question now is how this development came about. Changes in the level of segregation may occur, inter alia, through inward and outward movements or shifts between the groups of an indicator (such as.B naturalisations, increase in the general level of education or change in age group). In the present case, it seems that the development is mainly due to migration from the outside and is strongly related to the structural development in the city.
The trend of reurbanization, which began in Zurich at the end of the 1990s and continues to this day, was accompanied by strong population growth and significant immigration. As a result, the average level of education and income in the city of Zurich has risen steadily[6,7]. The creation of a better quality of life in the districts – with more attractive open spaces, traffic-calmed streets, a wide range of cultural activities or an improved range of childcare facilities – has made the city of Zurich a sought-after place to live again for many population groups. However, this trend of reurbanization is therefore also reflected in an increased demand for living space and consequently an increase in the rent level. Due to the increased housing supply, this immigration has taken place above average in the suburbs (next to the Escher Wyss district). And since many of these quarters had a comparatively low social status, the immigration of Zurich has brought the districts of Zurich into line over the years and the resident segregation has fallen city-wide.
From the available data, however, it is not possible to answer whether this development was accompanied by social displacement processes. New housing replacement construction has increased sharply during the period under consideration and now accounts for more than half of total housing activity[8], which makes a certain social redeployment of the resident population at least likely. However, it is also known that during the five tax years 2011 to 2015, people with lower incomes did not move out of the city disproportionately often. [9] More recent data are not yet available. Basically, however, the city of Zurich is in constant motion: Every year, almost 10% of the population leaves the city and a slightly higher percentage takes up residence in Zurich.
With its housing policy, the city of Zurich wants to promote the social mixing of its population, but without promoting social displacement processes. Even under the conditions of its high attractiveness as a residential location, the city uses proven and newly developed instruments for this purpose. It pursues an active land and housing policy, intensive support for subsidised housing for low incomes and is also committed to socially acceptable development in private housing projects.
------------------------------------
[1] «Structural renewal and social change», web article by Stefanie Jörg, Statistics City of Zurich, 29 September 2016.
[2] Intep – Integrale Planung GmbH (2020): "Resident segregation in the city of Zurich and surrounding communities".
[3] Duncan, Otis D. and Beverly Duncan (1955): "A Methodological Analysis of Segregation Indexes", American Sociological Review 20(2): 210-217.
[4] For the calculation of household equivalised income and its division into three categories, see the corresponding entry in the glossary.
[5] Urban Development Zurich (2020): "Socio-Spatial Monitoring in the Context of Population Growth and Structural Densification – Report 2020".
[6] City of Zurich (2017): «Increase in the social status' of the Zurich population», press release of March 2017.
[7] Although the level of education has risen sharply throughout Switzerland during this period, this increase has been even more pronounced in the city of Zurich.
[8] «Bauliche Verdichtung aktuell», web article by Urs Rey, Statistik Stadt Zürich, 7 April 2020.
[9] City of Zurich (2019): «Estimation of the socio-spatial development in Schwamendingen with special consideration of the Ueberlandpark (Social Report Ueberlandpark)», Supplement to STRB No. 940/2019.
More information
Glossary
Resident segregation: Resident segregation is defined as the degree of uneven distribution of population groups in a given spatial unit. Segregation can be voluntary or involuntary. For example, households often settle in neighbourhoods where they are not in the minority with their socio-economic, ethnic or socio-demographic characteristics. For example, families choose neighborhoods where other families already live. On the other hand, residential segregation can also take place involuntarily if, for example, people with low incomes are forced to move to urban districts that are less attractive from their perspective because they cannot afford another residential area.
Segregation index: The segregation index focuses on the individual population groups and measures how segregated a particular population group is from the rest of the population. His interpretation is very intuitive: he indicates what percentage of a certain group would have to move so that the population share of this group in all subunits would correspond to the population share of this group at the higher spatial level. The value range of the index ranges from 0 to 100, where 100 means complete segregation.
Theil Index: The Theil Index focuses on spatial unity and measures the degree of segregation across all population groups. It has the advantage of summarizing the segregation of different groups of the same indicator in one value. The calculation takes into account that not all of these population groups are of the same size. It has a value range from 0 to 1.
Household equivalised income: Household equivalised income is a weighted calculation of household income. It serves the comparability of households of different sizes and compositions. For the calculation, the total household income is divided by the number of persons in the household, whereby children are not counted in full (0.3 or 0.5 depending on age). The division into three classes in this article (<30,000 / 30,000-60,000 / >60,000) followed the logic that the three income groups at the city level should be as equal as possible.
Publications on the topic
Intep – Integrale Planung GmbH (2020): "Resident segregation in the city of Zurich and surrounding communities"
Urban Development Zurich (2020): "Socio-spatial Monitoring in the Context of Population Growth and Structural Densification – Report 2020"