
Development of social status by neighbourhood
9.3.2017 - Andrea Büchi
A person's social status describes their social position in a society. The present analysis defines social status as a combination of education (highest level of education) and household income (gross, annual), whereby these two status variables are based on self-declaration of the respondents of the population survey of the city of Zurich. Gross household income was collected in seven specified income classes.
In the following, the development of the social status in the city as a whole is compared with that in individual districts or territorial units of the city at four measurement times. The population survey was conducted in odd-numbered years. In order to ensure a sufficient sample size, the data from two consecutive surveys were combined. Therefore, a double year is given as the measurement time (e.B. 2001/03). To anticipate it: Not in all districts was the development as linear as the overall urban changes suggested. Roughly five groups of quarters and the Werd/Langstrasse area with a special development can be distinguished.
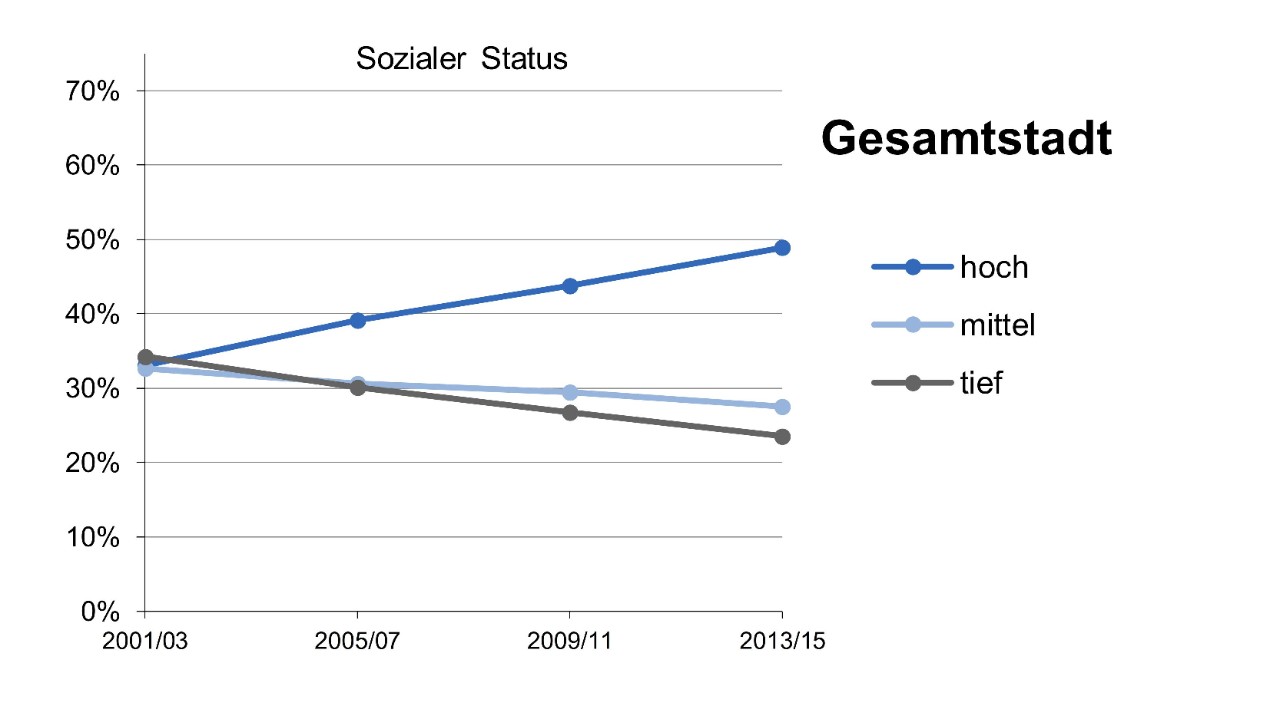
1. Overall urban development
With a share of 49 percent, around half of the respondents in the city of Zurich had a high social status at the time of measurement in 2013/2015. 27 percent of respondents have a medium social status, 24 percent a low social status. This ratio has changed significantly since the first measurement date in 2001/2003: At that time, around one third of the respondents in the city of Zurich had a high, medium or low social status. The percentage of respondents with a high social status has thus increased by around half over a period of twelve years. At the same time, the proportion of respondents with a low social status has decreased. And the proportion of respondents with a medium social status has also decreased over the period under consideration. All three status developments were steady.
2. Developments by district
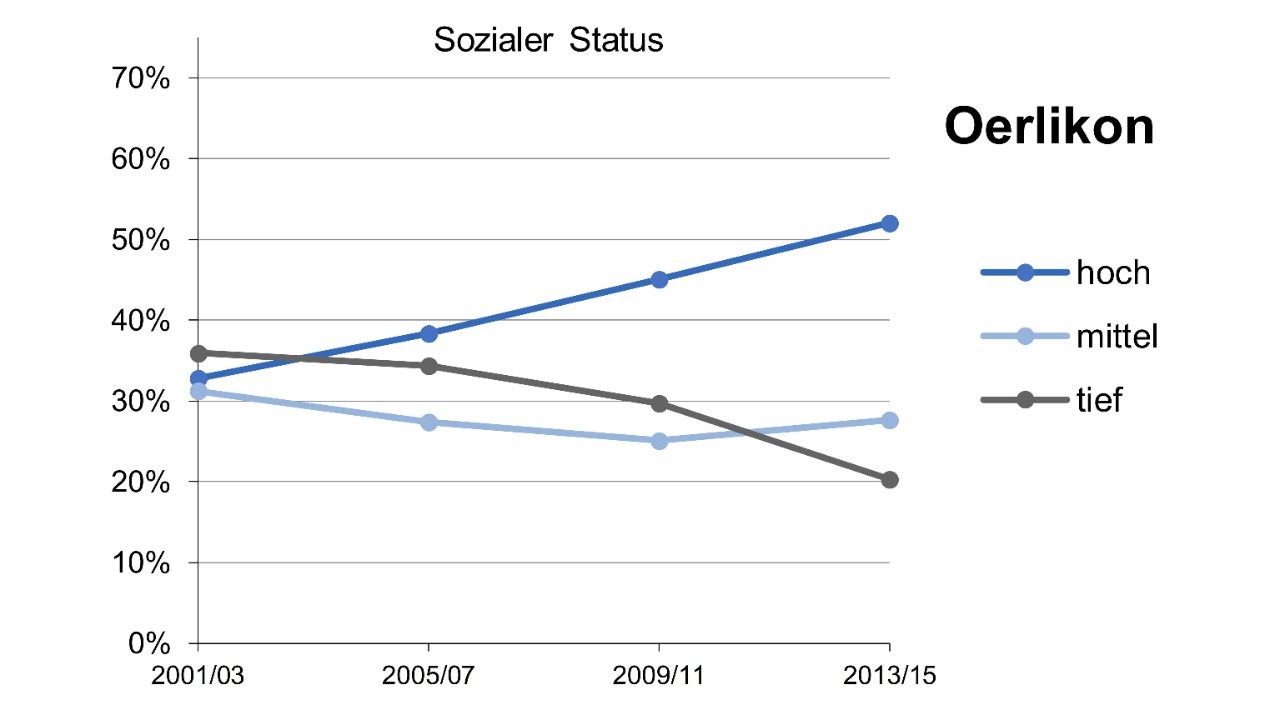
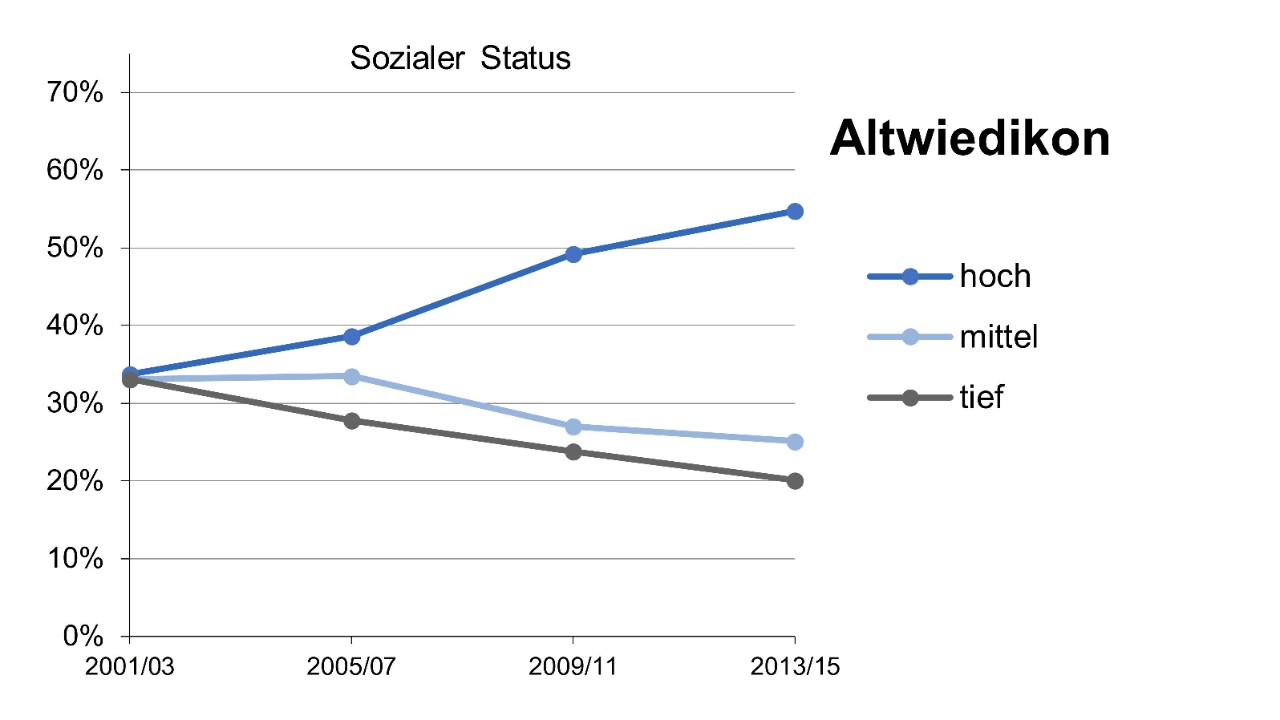
2.1 Districts with similar development to the city as a whole
The development of the social status in the districts of Oerlikon and Altwiedikon is most similar to that of the city as a whole: Here, too, the proportions of respondents with a high, medium or low social status in 2001/03 accounted for around one third each. The proportion of people with a high social status has steadily increased since then, while the proportion of respondents with a medium or low social status has decreased.
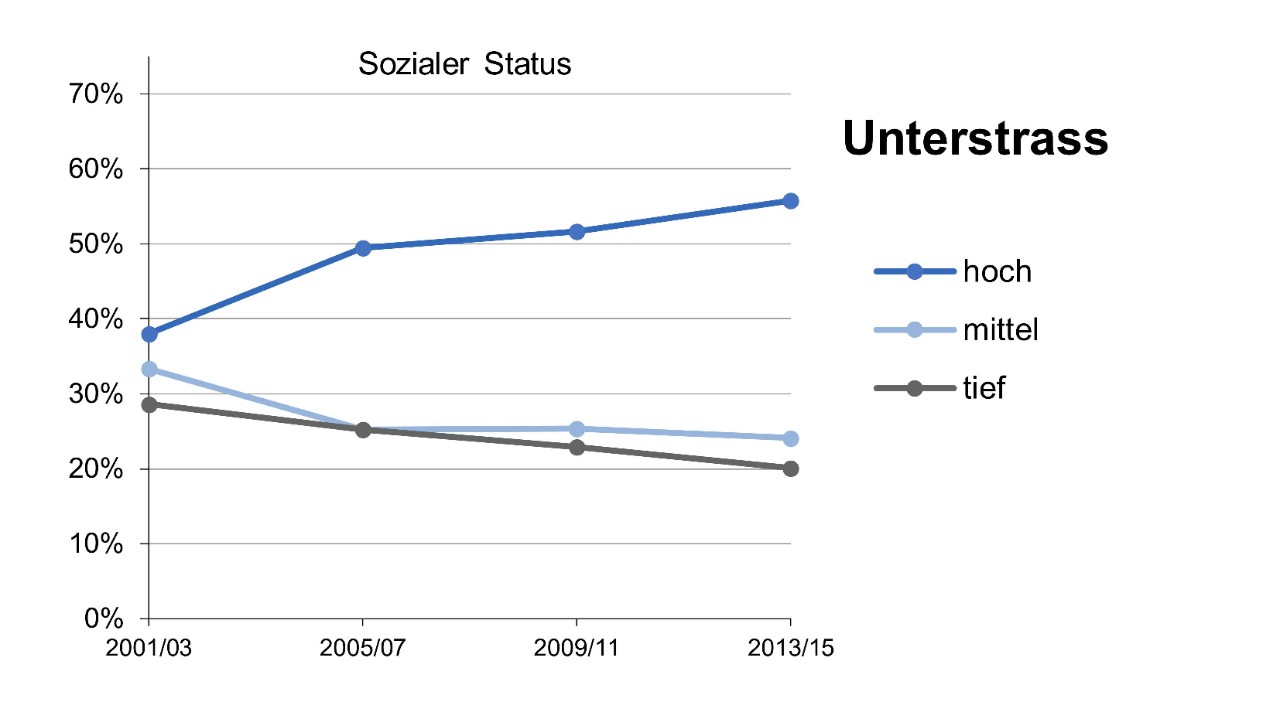
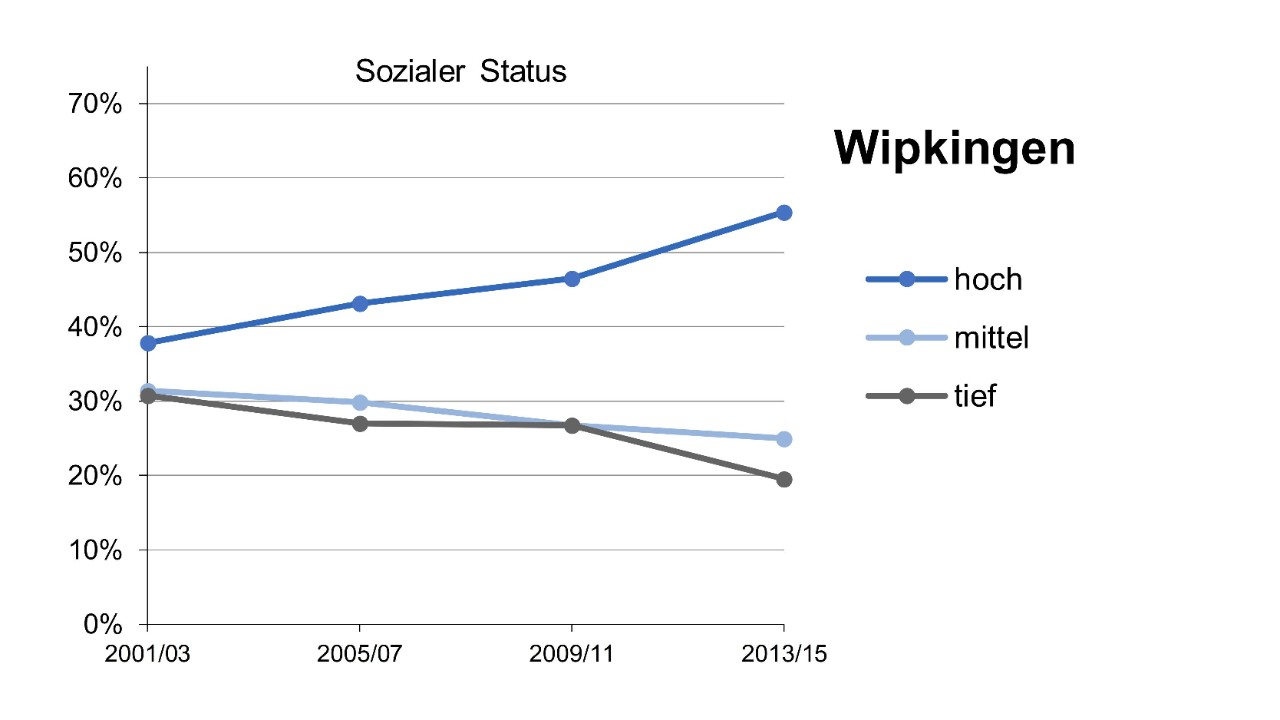
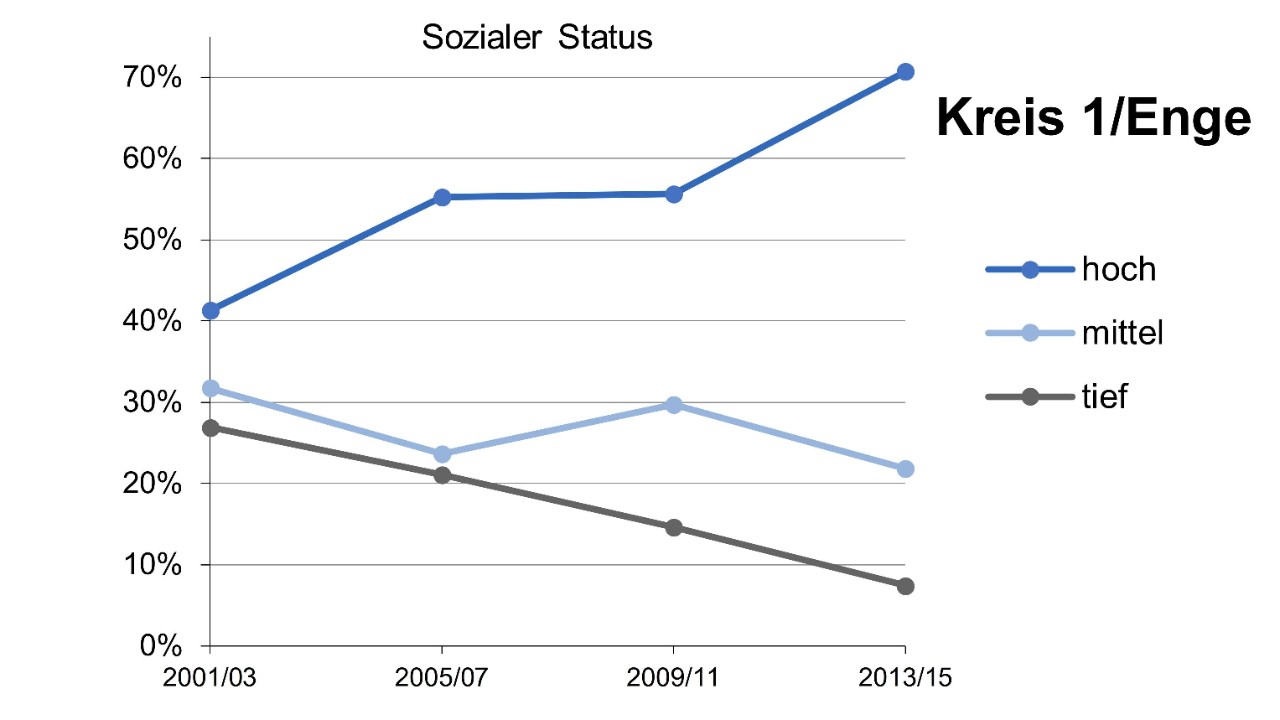
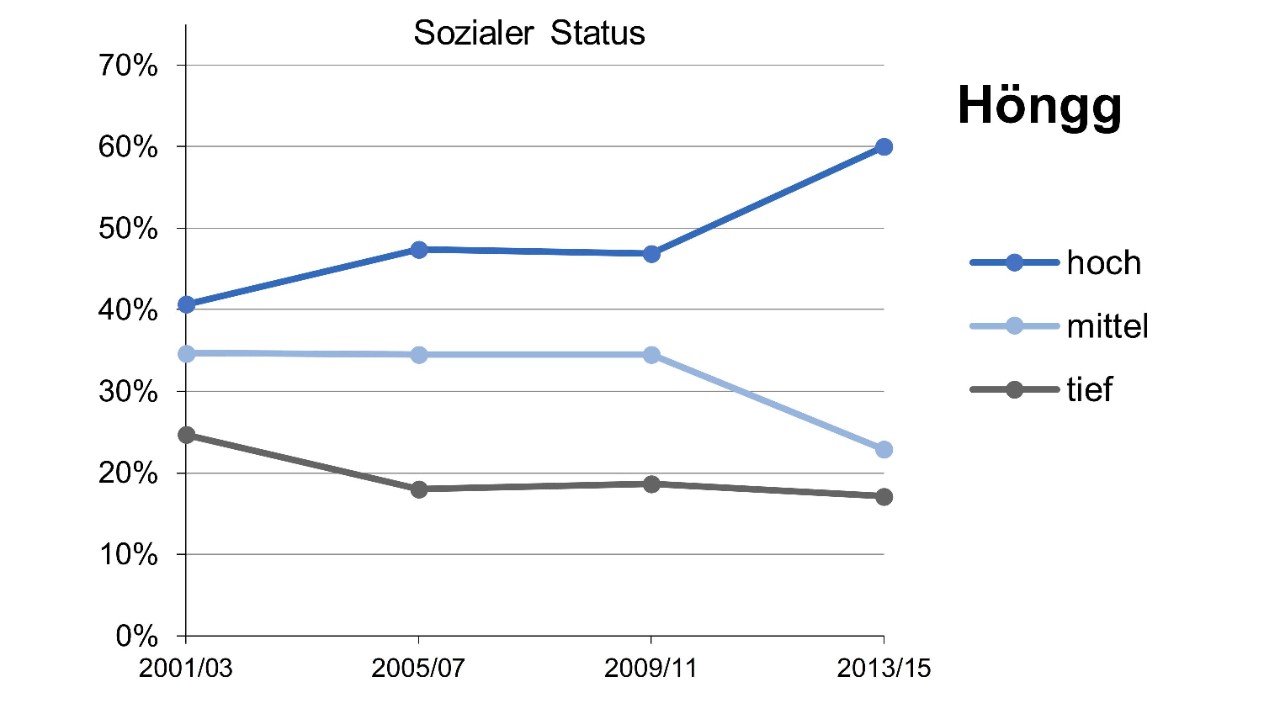
A similar overall development as in the city as a whole can also be seen in the districts of Kreis 1/Enge, Unterstrass, Höngg and Wipkingen (for information on the summary of quarters, see text box at the end). However, the starting position differs in these districts: as early as 2001/03, the proportions of respondents with a low, medium or high social status were less balanced, while the proportion of respondents with a high social status was the highest everywhere. Over time, the proportion of respondents with a high social status continued to increase. Especially in Kreis1/Enge, Höngg and Wipkingen it has grown significantly since 2009/11 (in Kreis 1/Enge a strong increase was already recorded between 2001/03 and 2005/07). The most massive increase in status is in District 1/Enge: At the time of measurement 2013/15, the proportion of respondents with a high social status there is one of the highest (next to Oberstrass and Fluntern), and the proportion of respondents with a low social status is one of the lowest in the district comparison (together with Oberstrass and Fluntern).
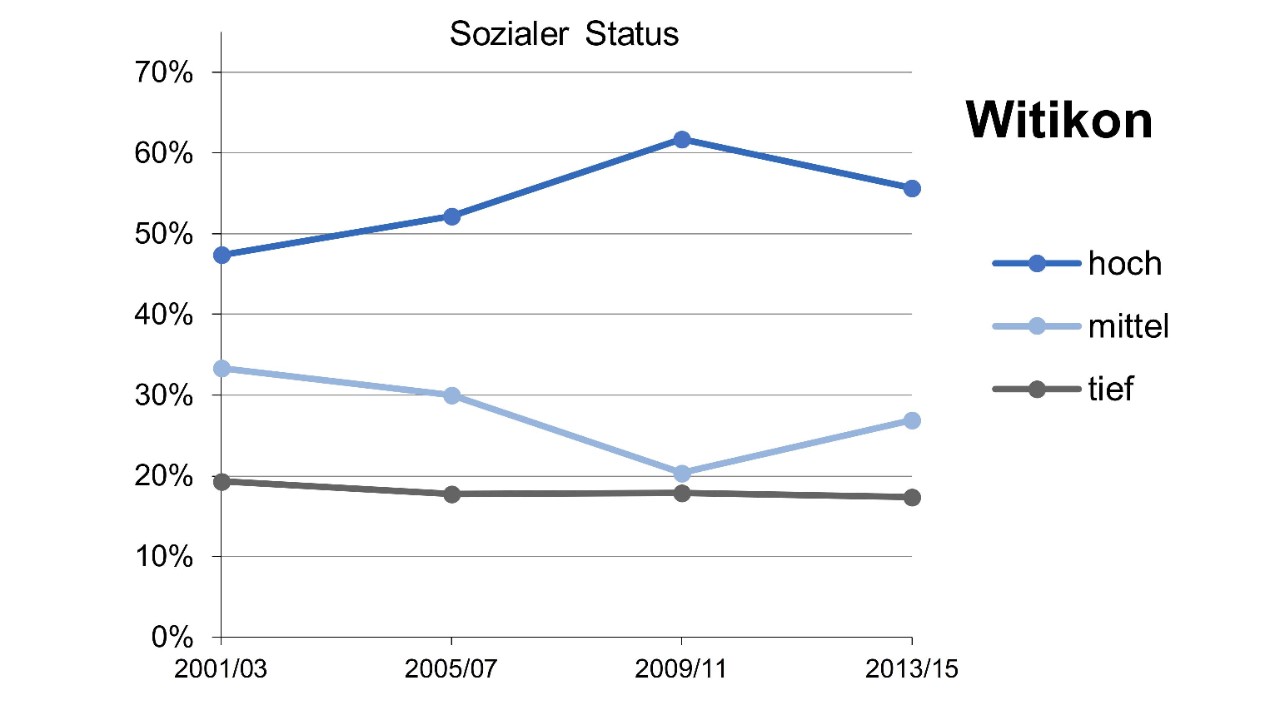
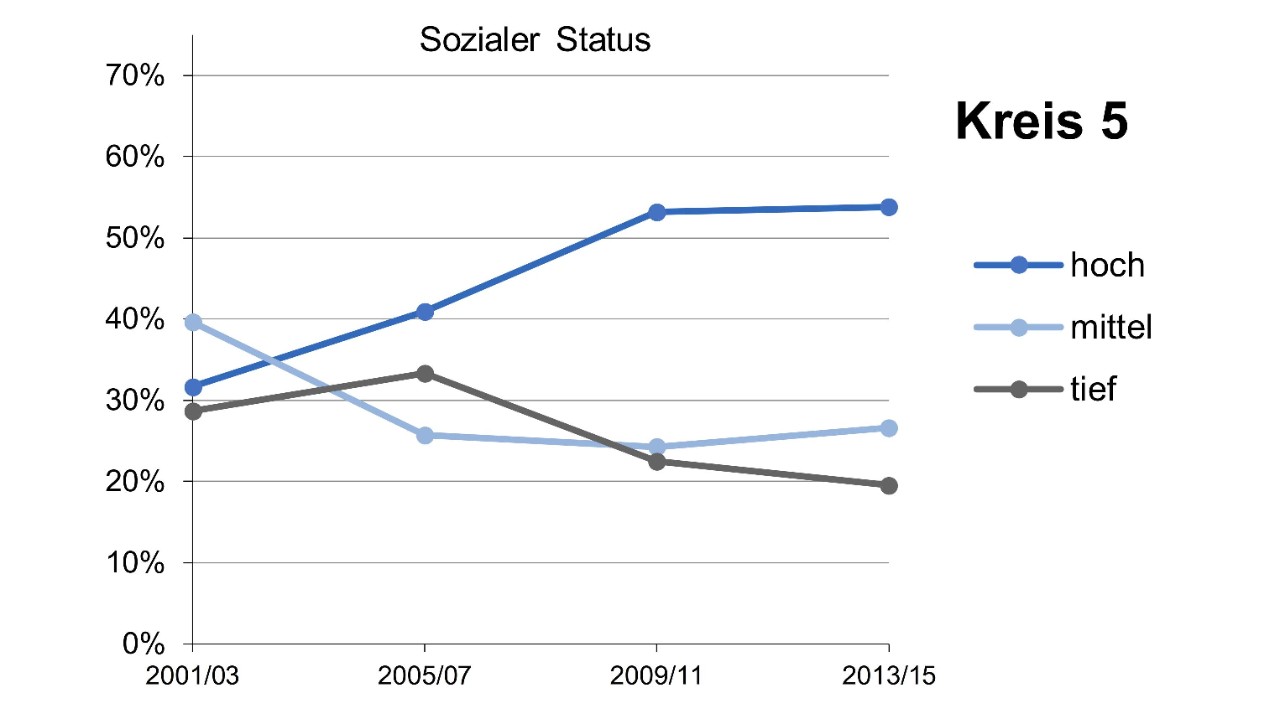
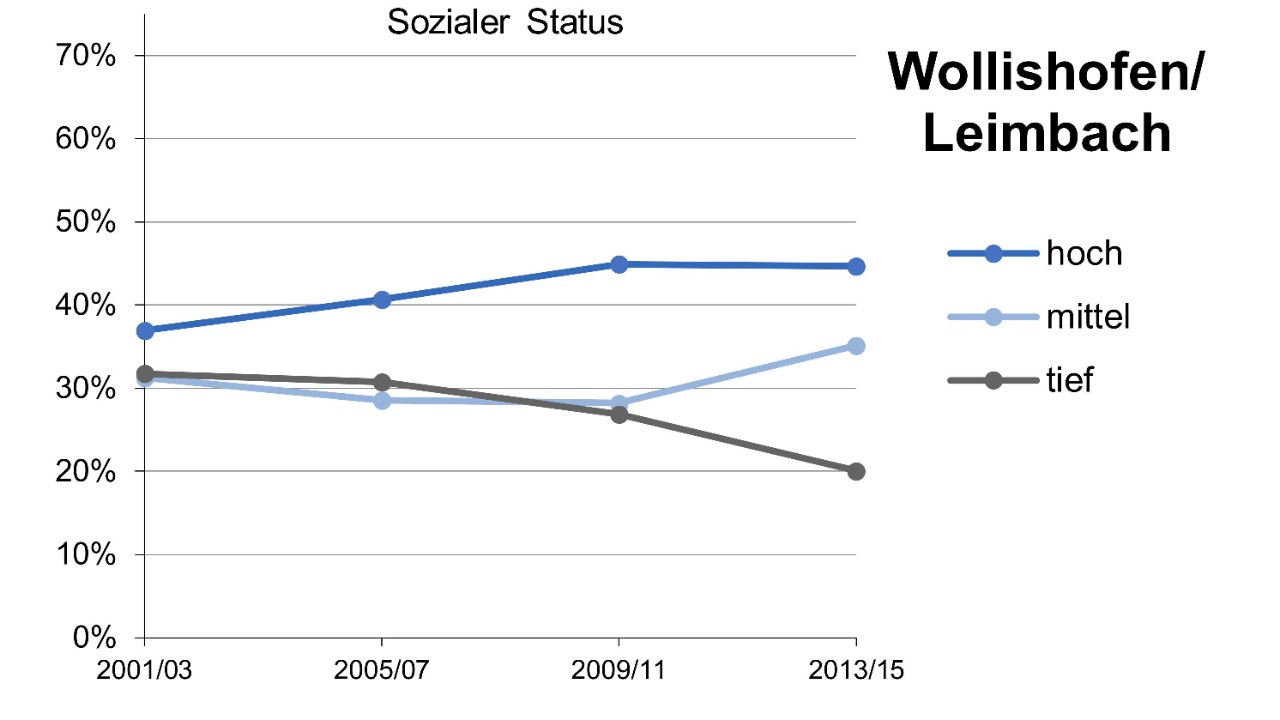
2.2 Neighbourhoods with a stagnating share of high social status
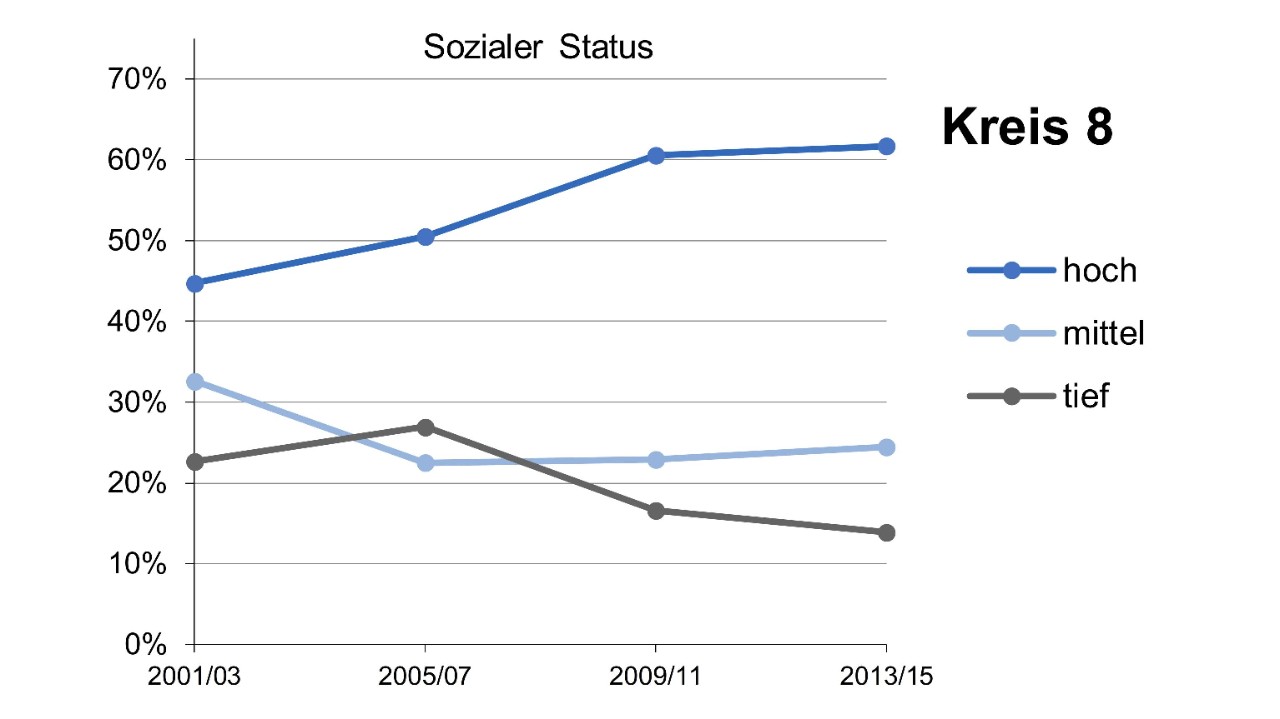
In Wollishofen/Leimbach, District 8, District 5 and Witikon, the proportion of people with a high social status also increased until 2009/11, but remained constant afterwards or even decreased in Witikon. On the other hand, from 2009/11 onwards, the proportion of people with a medium social status tended to grow. In 2013/15, Wollishofen/Leimbach is one of the districts with the highest proportion of people with a medium social status (next to the Saatlen/Schwamendingen district).
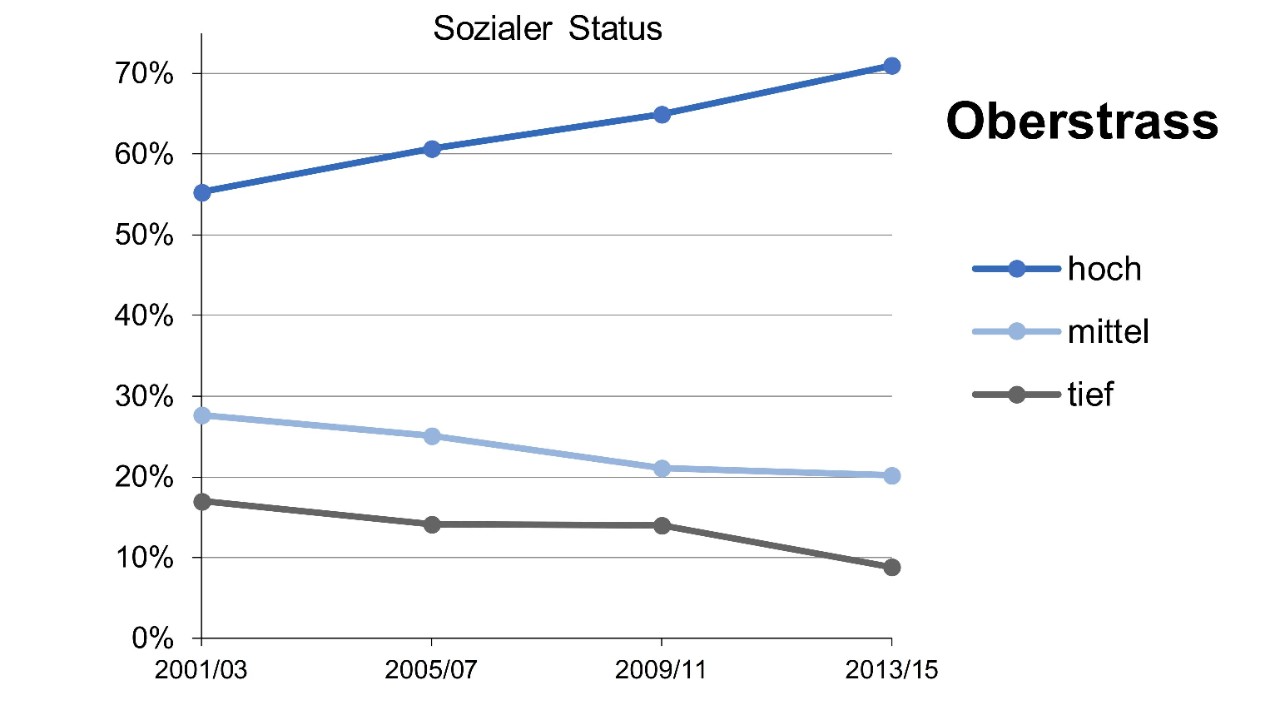
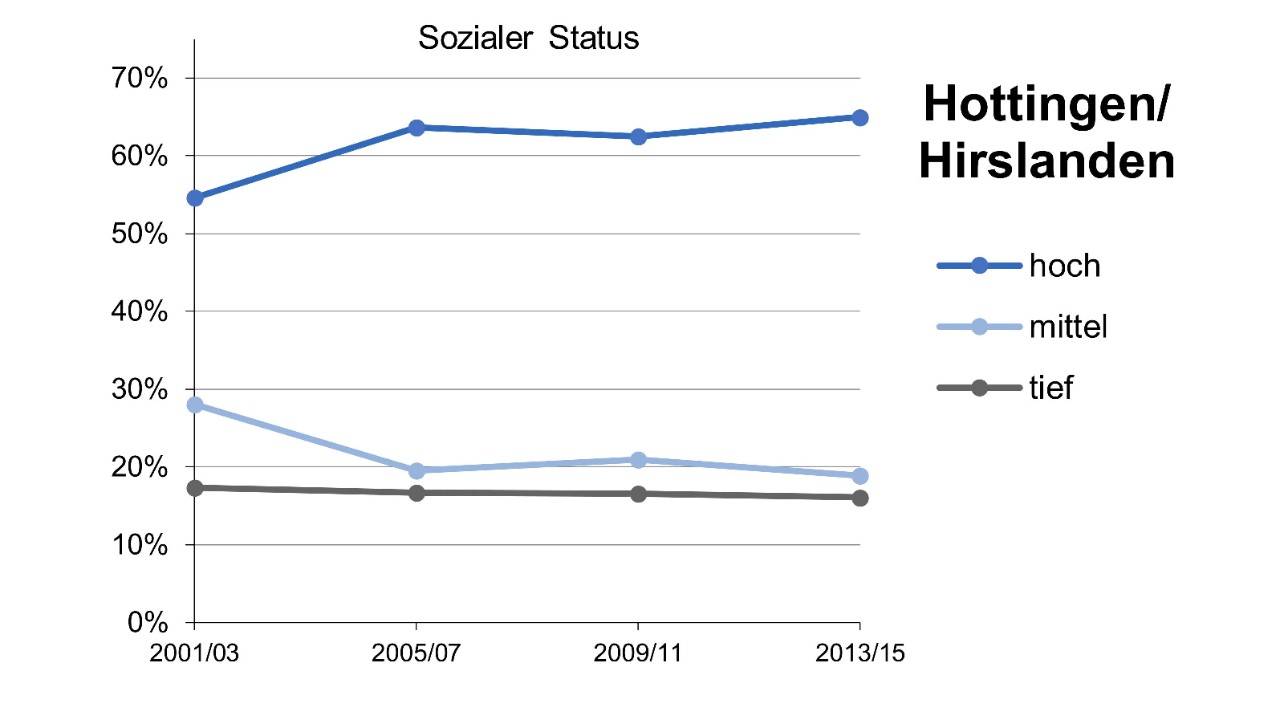
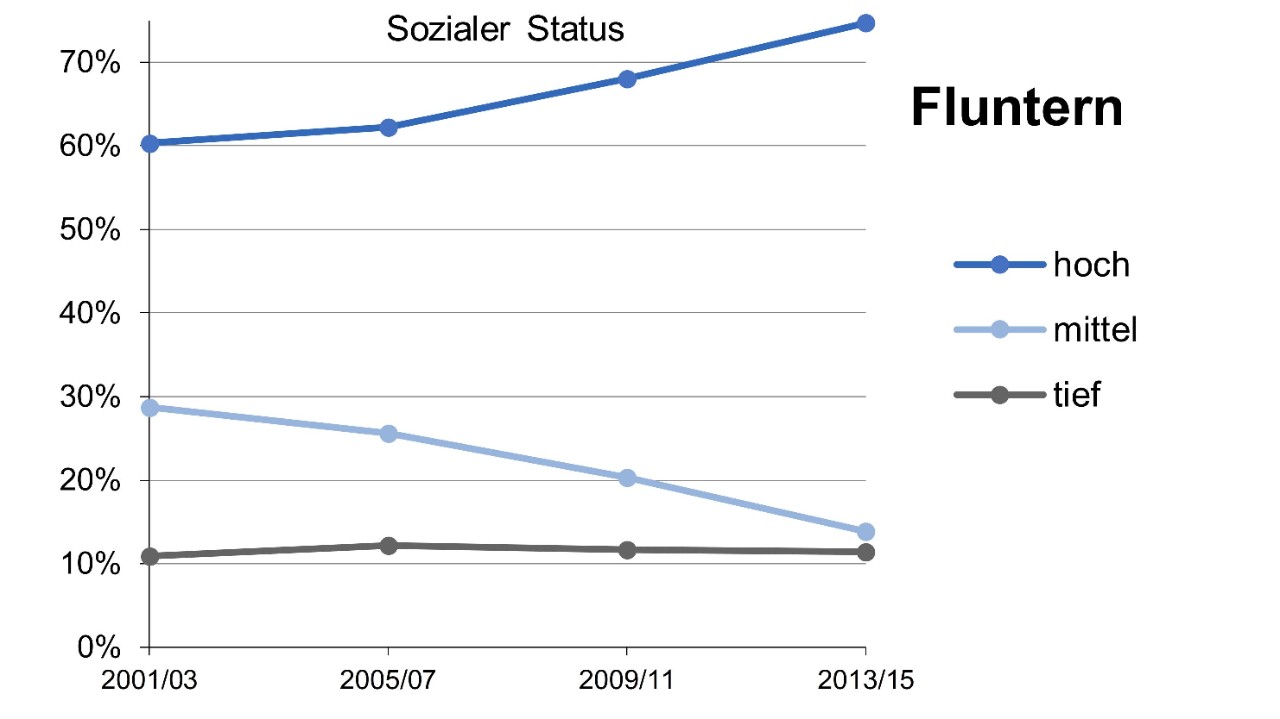
2.3 High-status districts with further increase in status
In the districts of Oberstrass, Fluntern and Hottingen/Hirslanden, the proportion of respondents with a high social status was already high at the first measurement time in 2001/03. Over time, it rose even more. In Fluntern and Oberstrass, the proportions of people with a high social status are highest in 2013/15 compared to the districts (next to District 1/Enge). The proportion of respondents with a low social status tended to decline in Oberstrass and remained constant in Fluntern and Hottingen/Hirslanden. The proportion of people with a medium social status also decreased over time (Oberstrass, Fluntern) or remained constant in recent years (Hottingen/Hirslanden). In Fluntern, the proportion of people with a medium social status is the lowest in 2013/15 compared to all districts.
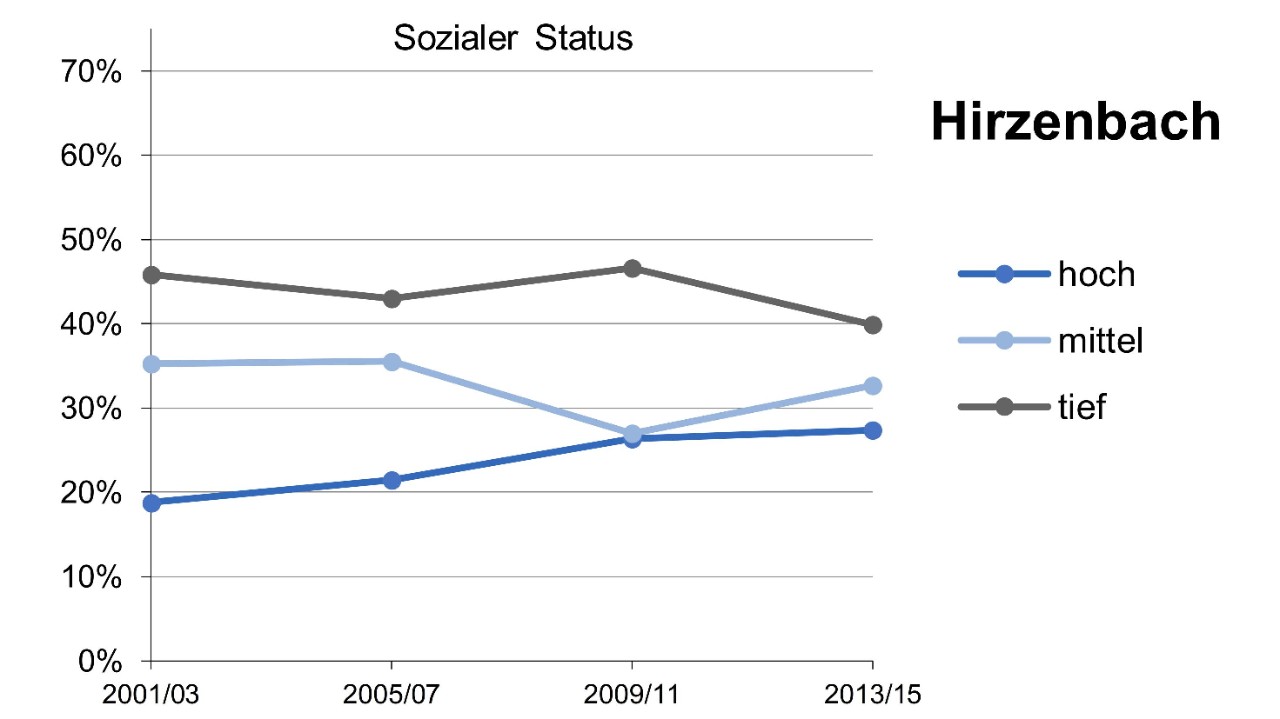
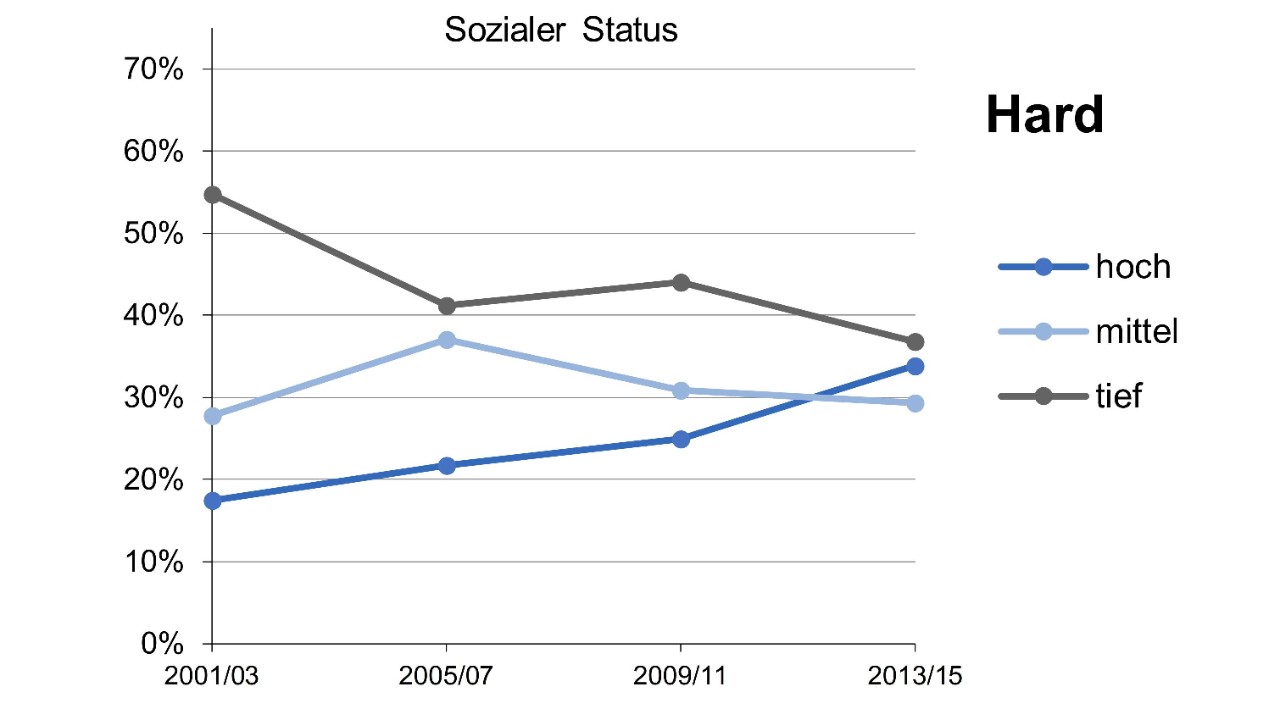
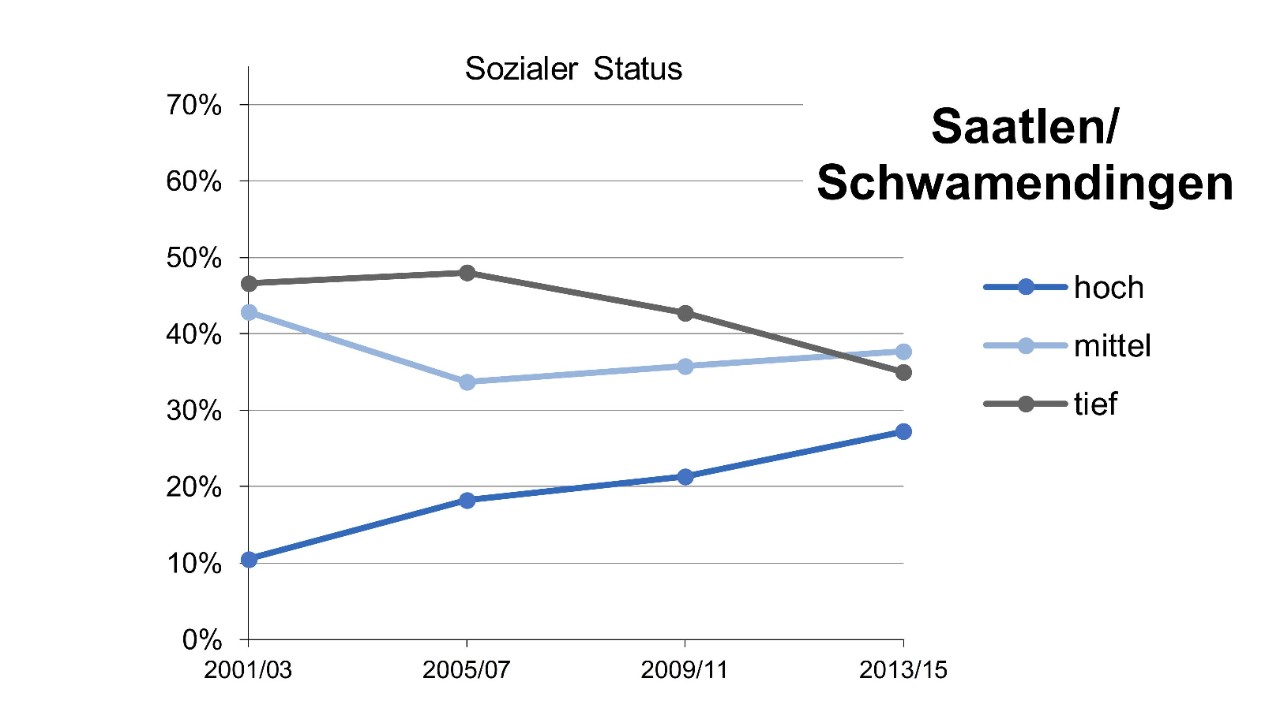
2.4 Status-depth districts with aligning shares
In Hard, Saatlen/Schwamendingen and Hirzenbach a different picture emerges compared to the city as a whole: The shares of the three social statuses were different in 2001/03 and converged over time. Here, too, the proportion of respondents with a high social status increased over time and the proportions of respondents with a low social status decreased. The difference can be seen in the initial situation: At the time of measurement 2001/03, there were conspicuously high proportions of respondents with a low social status (highest in Hard) and at the same time conspicuously low proportions of respondents with a high social status (lowest in Saatlen/Schwamendingen). Although the proportion of people with a low social status has fallen over time, in 2013/15 they are still the highest in a neighbourhood comparison. The proportion of people with a high social status increased over time, but they only came close to the same level as the lower statuses in Hard. Saatlen/Schwamendingen and Hirzenbach therefore have the lowest proportions of people with a high social status in 2013/15. In addition, Saatlen/Schwamendingen 2013/15 has the highest proportion of people with a medium social status.
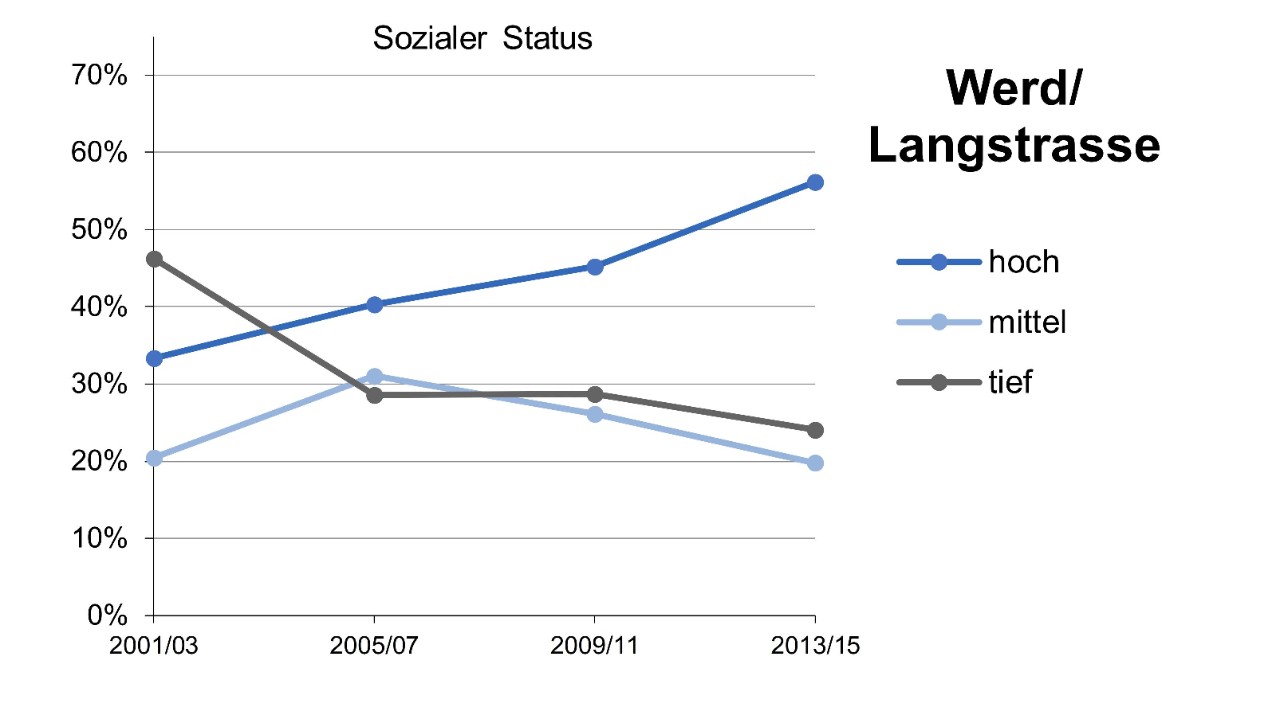
2.5 Werd/Langstrasse area: Status depth starting position and massive status increase
In Werd/Langstrasse, too, the proportion of respondents with a low social status was remarkably high in 2001/03. At the same time, however, the proportion of respondents with a high social status was significantly higher than in Hard Saatlen/Schwamendingen or Hirzenbach, and it grew so strongly over time (especially since 2009/11) that at the time of measurement 2013/15 it is as high as in Altwiedikon, Wipkingen, Witikon or Unterstrass. Between the measurement dates 2001/03 and 2005/07, the proportion of people with a medium social status increased sharply, the proportion of respondents with a low social status decreased markedly.
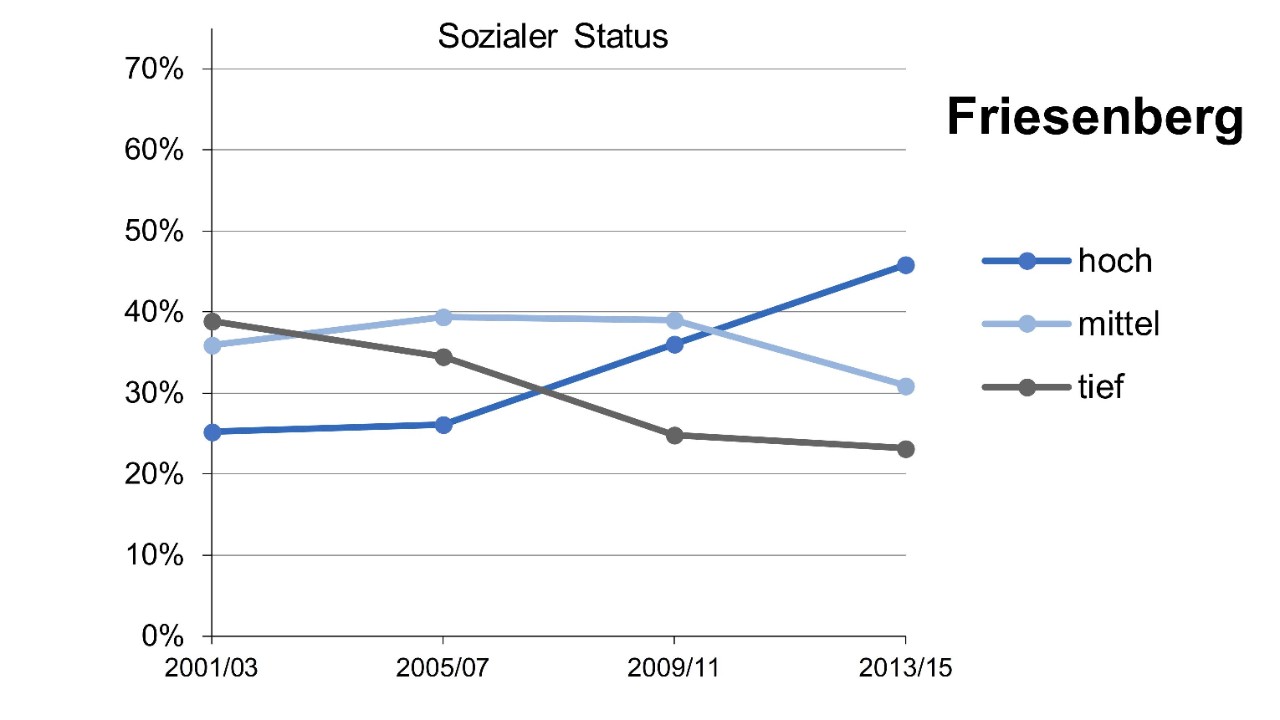
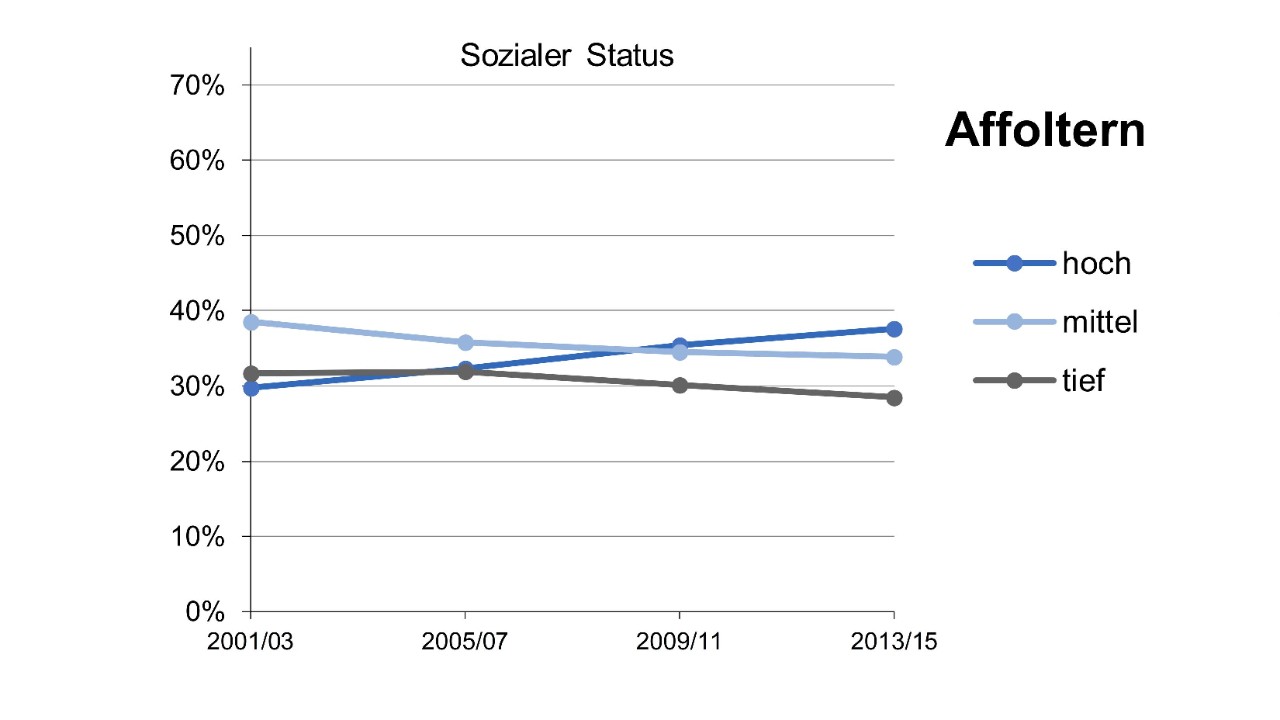
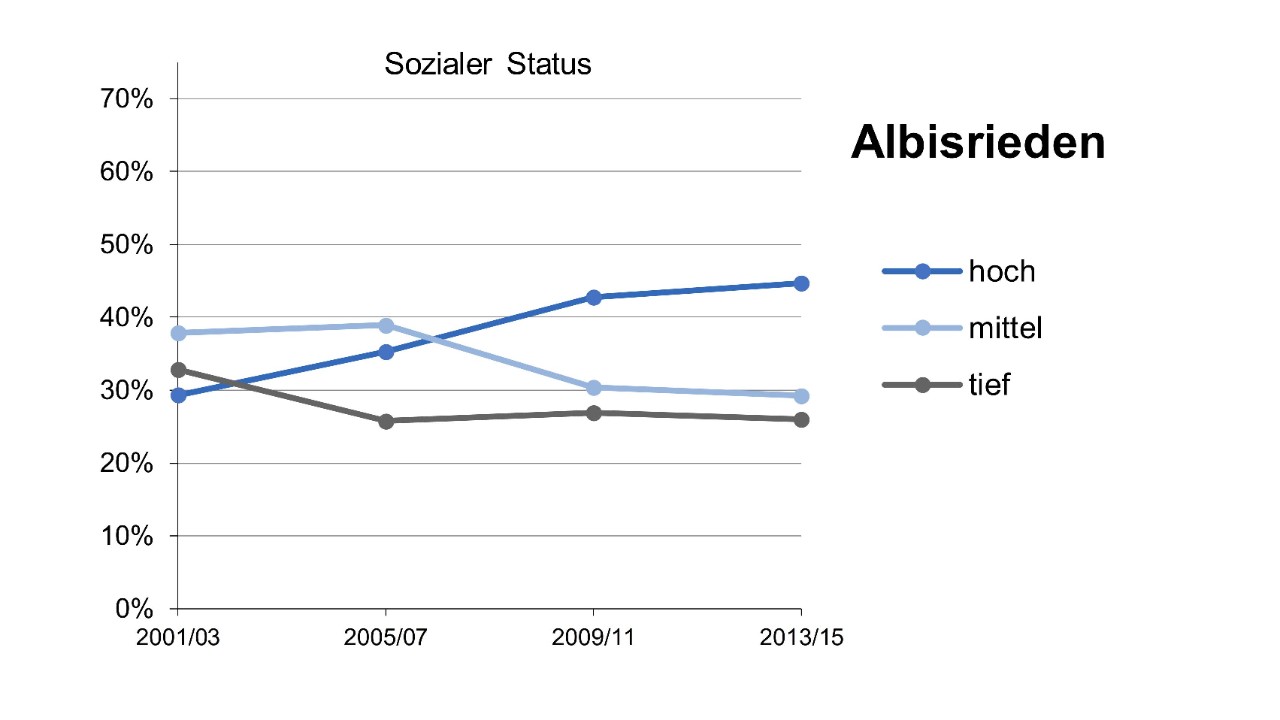
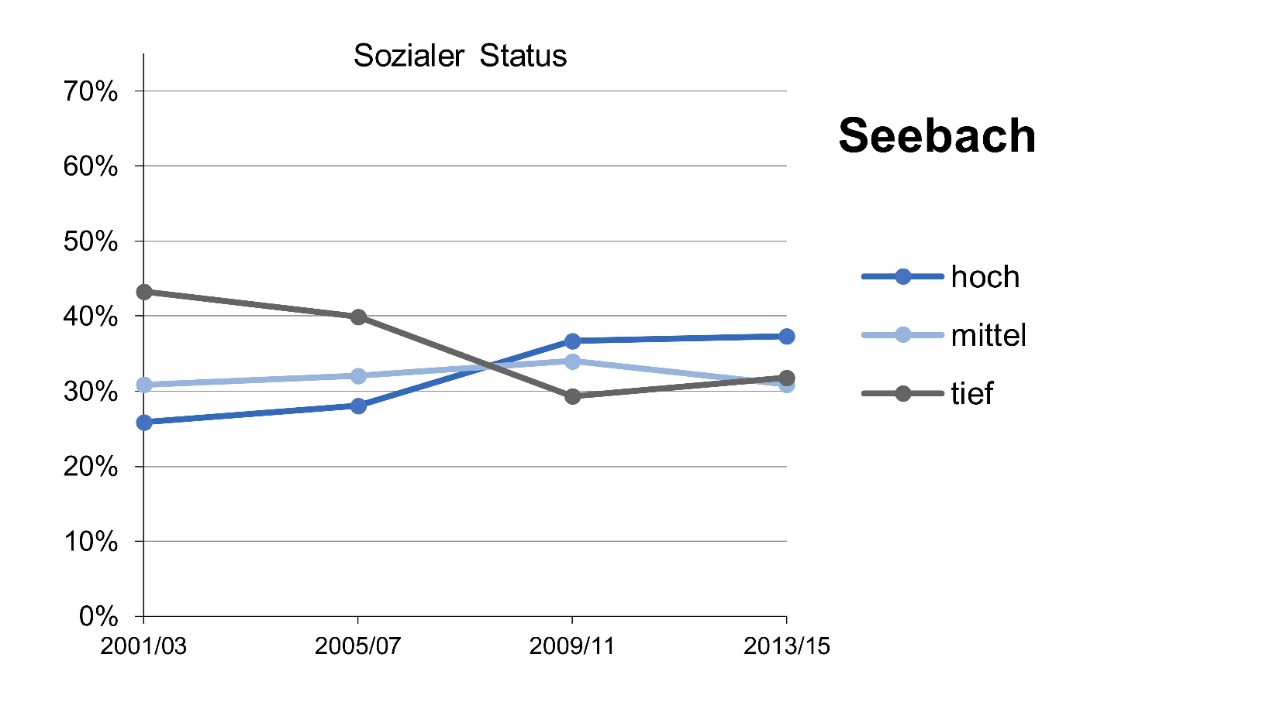
2.6 Neighbourhoods with less significant changes
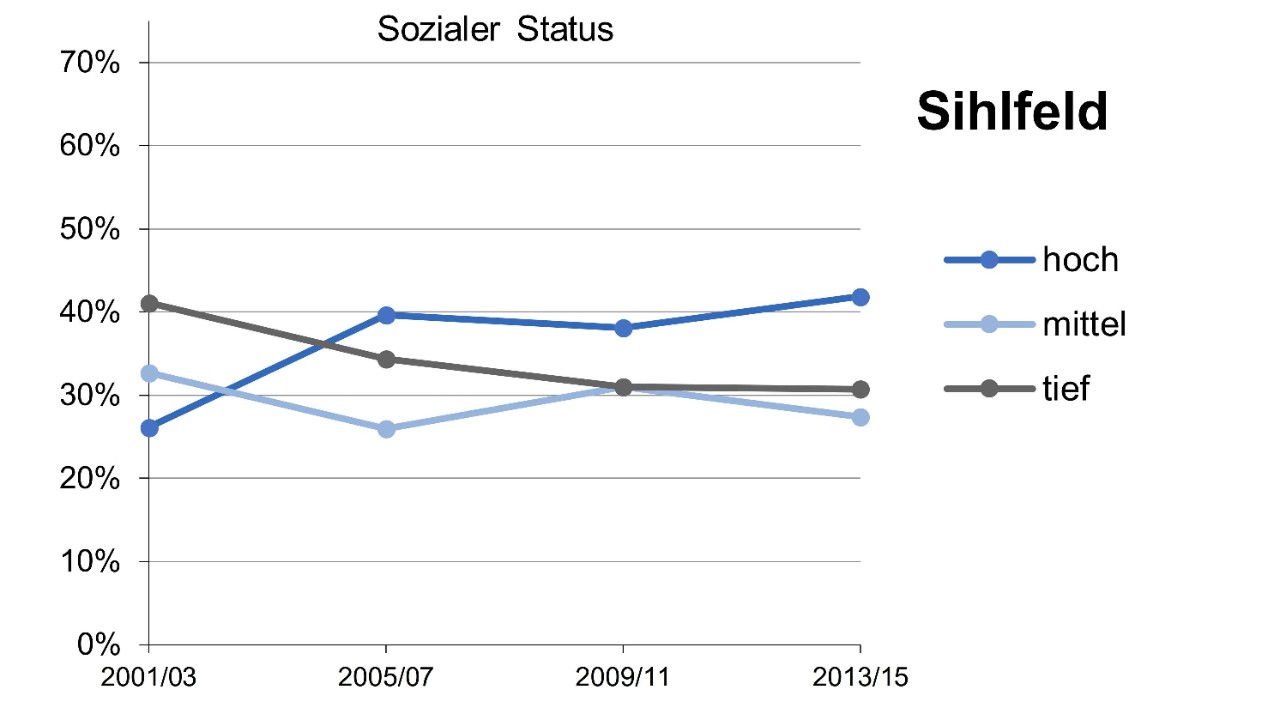
Finally, there are a number of neighbourhoods in which the proportion of respondents with a high social status was the smallest at the time of measurement in 2001/03 and developed into the largest by 2013/15. Especially in Friesenberg, Albisrieden and Sihlfeld, the proportion of people with a high social status rose sharply, so that in 2013/15 it was significantly higher than the proportion of people with a medium or low social status. Especially in Affoltern and Seebach, the changes over time are comparatively small.
3. Conclusion
In general, it can be stated that all city districts recorded an increase in status between 2001/03 and 2013/15. The proportion of respondents with a high social status has increased continuously throughout the city. Although the shares of the three status groups in most districts moved in the same direction, the developments in the districts – sometimes due to different initial situations – proceeded to different degrees and / or time.
More information
Method / Sources
The underlying data are the results of the population survey from the years 2001 to 2015. The population survey has been conducted biennially since 1999, each spring, by means of telephone interviews (CATI) by the LINK Institute for Market and Social Research in Zurich. A total of around 2500 people living in the city were interviewed per survey year. Due to the sample size, individual districts with a low population were combined into larger territorial units. This measure concerns District 1/Enge, Wollishofen/Leimbach, Werd/Langstrasse, District 5, Hottingen/Hirslanden, District 8, Saatlen/Schwamendingen.
The sample size per survey year does not allow to interpret small differences between subgroups. For this reason, the data on social status were aggregated (pooled) over two survey years. The N for the city as a whole is an average of 4300 respondents per designated measurement time; for the individual districts or territorial units, it is around 200 respondents. The values for the city as a whole are based on weighted data, the values per individual district are unweighted. The answer categories "do not know" and "no information" are defined as missings and excluded for the calculation.
Definition of «Social Status»
For the present analysis, the sum index "Social Status" was formed from the two variables highest completed school or vocational training and annual gross income of the household. These are self-declarations of the respondents. The sum index "Social Status" therefore differs, for .B, from the definition of the Federal Statistical Office, which forms a status index as a measure of the social status of the population from six indicators , see FSO website. Nor may a medium social status be equated with the "Mittelstand" (in which the annual taxable income serves as the basis for calculation).
When interpreting the changes over time, it should be noted that the underlying income classes to gross household income and their classification have remained identical over all measurement times. Over time, the percentage distribution of the different household sizes of the respondents has also remained stable. An adjustment was made in 2013 with regard to educational qualifications: According to the requirements of the Federal Statistical Office (FSO), completed training at universities of applied sciences (in particular HTL and HWV degrees) as well as at universities of teacher education has also been counted among the university degrees (tertiary level) since that time. In previous population surveys, the university of applied sciences degrees were assigned to higher vocational education and training (also tertiary level). Degrees at universities of teacher education have not yet been recorded separately; Before 2013, teacher training courses all fell within the "Upper Secondary Level: General Education".
The overview in the download (see below) shows how the characteristics of social status are composed of the variables education and gross household income.